matplot畫圖程式庫
matplotlib及其數值數學擴展包 NumPy是利用Python程式語言進行數值方法學習時非常重要的兩個工具。同學們只要能夠熟悉PYTHON語言的基本語法,及善用matplot和NUMPY這兩個資料庫的許多工具,來完成數值計算和繪圖顯示,就可以學到整個數值方法的精髓。
在這一個小單元當中我們要介紹matplot的繪圖基本套件。
同學們可以參考下列網站有關matplot所做的簡單介紹:
以下是本課程相關的matplot的基本用法說明:
利用numpy建立畫圖數據 利用numpy建立拋體運動數據並且畫圖 利用openCV+numpy處理圖形檔案
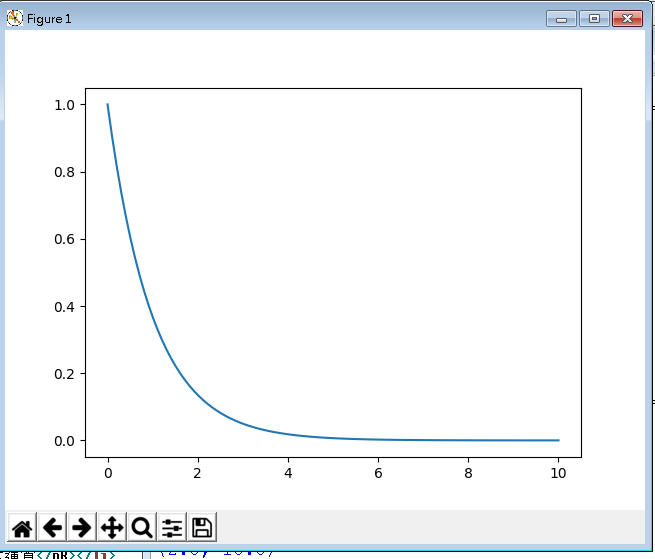
import matplotlib
import matplotlib.pyplot as plt
matplotlib.use("Agg")
import numpy as np
x = np.linspace(0,10,100)
y = np.exp(-x)
plt.plot(x,y)
plt.savefig("matplot-1.png")
print ('plot is done')
|
 |
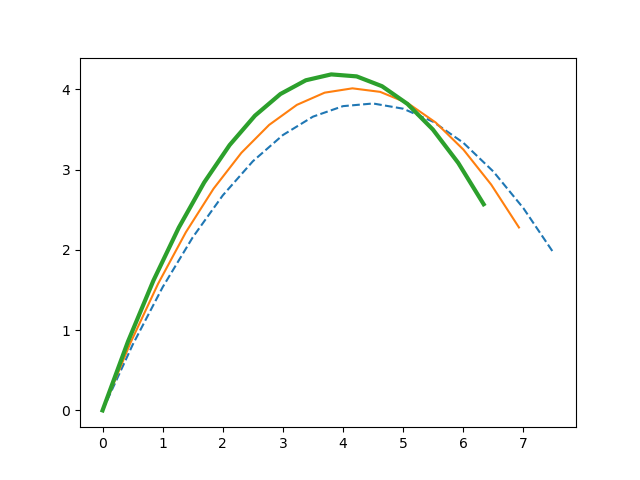
import numpy as np
q=np.radians(60); v0=10.;g=9.8
cos=np.cos; sin=np.sin
t=np.arange(0,1.6,0.1)
x=v0*cos(q)*t
y=v0*sin(q)*t-1/2*g*t**2
for i in range(len(t)):
    print('{0:6.1f} {1:8.4f} {2:8.4f}'.format(t[i],x[i],y[i]))

import matplotlib.pyplot as plt
plt.plot(v0*cos(q)*t,v0*sin(q)*t-1/2*g*t**2,'--')
q=np.radians(62.5);
plt.plot(v0*cos(q)*t,v0*sin(q)*t-1/2*g*t**2)
q=np.radians(65)
plt.plot(v0*cos(q)*t,v0*sin(q)*t-1/2*g*t**2,lw=2)
plt.savefig("Proj-60-a.png")
|
 |
# coding=big5
import cv2
#img1 = cv2.imread("square-1.png")  #將圖片檔案讀進來
img1 = cv2.imread("square-1.png",cv2.IMREAD_GRAYSCALE)  #將圖片檔案讀進來並轉成灰階
img2 = cv2.imread("square-2.png",cv2.IMREAD_GRAYSCALE)  #將圖片檔案讀進來並轉成灰階
img3 = cv2.imread("square-3.png",cv2.IMREAD_GRAYSCALE)  #將圖片檔案讀進來並轉成灰階
print(img1.shape)
print(img2.shape)
(x,y)=img1.shape
print(x,y,x*y)
nn=0; n2=0; n3=0
for j in range(0,y):
    for i in range(0,x):
        nn+=1
        d1=img1[i][j]
        d2=img2[i][j]
        d3=img3[i][j]
        dd2=abs(d1-d2)
        dd3=abs(d1-d3)
        if(dd2 > 2): n2+=1; #print(i,j,d1,d2,dd)
        if(dd3 > 2): n3+=1; #print(i,j,d1,d2,dd)
print(nn,n2,n2/nn)
print(nn,n3,n3/nn)
|
(160, 202) (160, 202) 160 202 32320 32320 324 0.010024752475247525 32320 952 0.029455445544554454 |

|