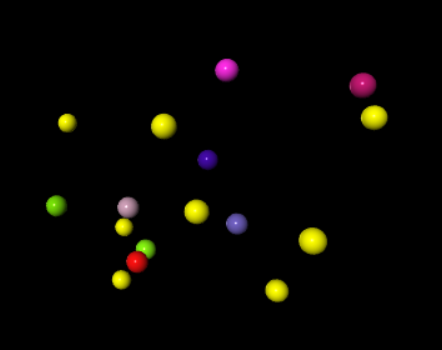
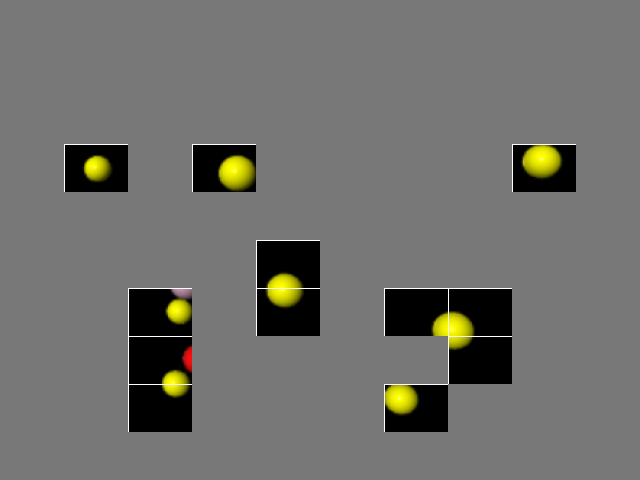
- 利用openCV分析圖片中黃球的影像和數量
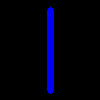
- 利用openCV製作數字圖片
- 利用openCV製作Angry Bird圖片
- 結合matplotlib與openCV製作圖片
- 利用openCV製作輪廓的圖片
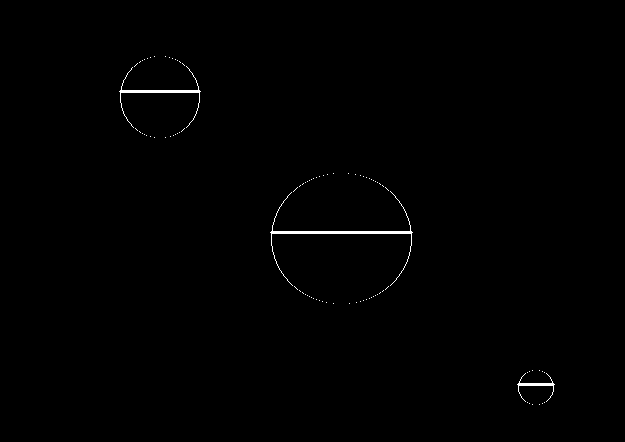
- 利用openCV測量圓的半徑
|
|
|

|

|
import numpy as np
import cv2

def num1(C1):
    img1=np.zeros((100,100,3))
    cv2.line(img1, (50, 10), (50, 90), C1, 5)
    return img1

C=[[255,0,0], [0,255,0], [0,0,255]]
img1=num1(C[0])
cv2.imwrite('number1.png',img1)
cv2.imshow('img1',img1)
cv2.waitKey(0)
cv2.destroyAllWindows()
|
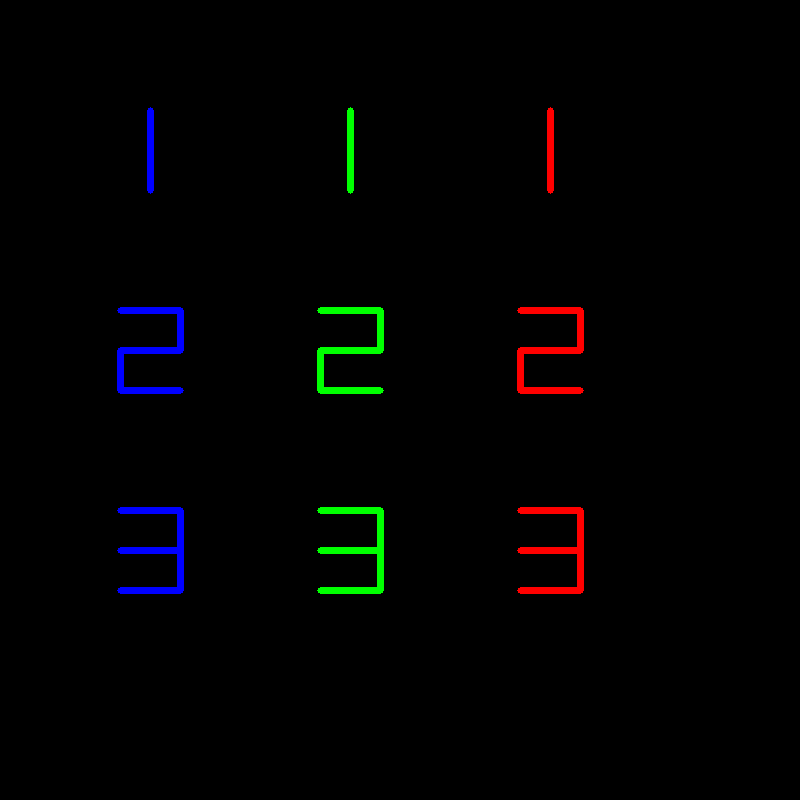
import numpy as np
import cv2

def num1(C1):
    img1=np.zeros((100,100,3))
    cv2.line(img1, (50, 10), (50, 90), C1, 5)
    return img1

C=[[255,0,0], [0,255,0], [0,0,255]]
img1=num1(C[0])
cv2.imwrite('number1.png',img1)
cv2.imshow('img1',img1)

img4=np.zeros((800,800,3),dtype=np.uint8)
img2=num1(C[1])
#img2=cv2.imread('number1.png')
img4[150:250,300:400,:]=img2[:,:,:]
img4[650:750,300:400,:]=img2[:,:,:]
cv2.imshow('img2',img2)
cv2.imshow('img4',img4)

cv2.waitKey(0)
cv2.destroyAllWindows()

|

|
參考程式
import numpy as np
import cv2

L=800; Nx=20; LX=50
img4=np.zeros((L+LX,L+LX,3),dtype=np.uint8)
print(img4.shape)
for i in range(1,Nx):
    x=1/Nx*i
    y=np.sin(x*np.pi)*0.9
    X=int(x*L); Y=L-int(y*L)
    if(i%2==0): th=-1
    else: th=3
    cv2.circle(img4,(X,Y), 15, (0, 125, 255), th)
    print(i,X,Y)
cv2.imshow('img4',img4)
cv2.imwrite('cicles_sine.png',img4)
cv2.waitKey(0)
cv2.destroyAllWindows()
|
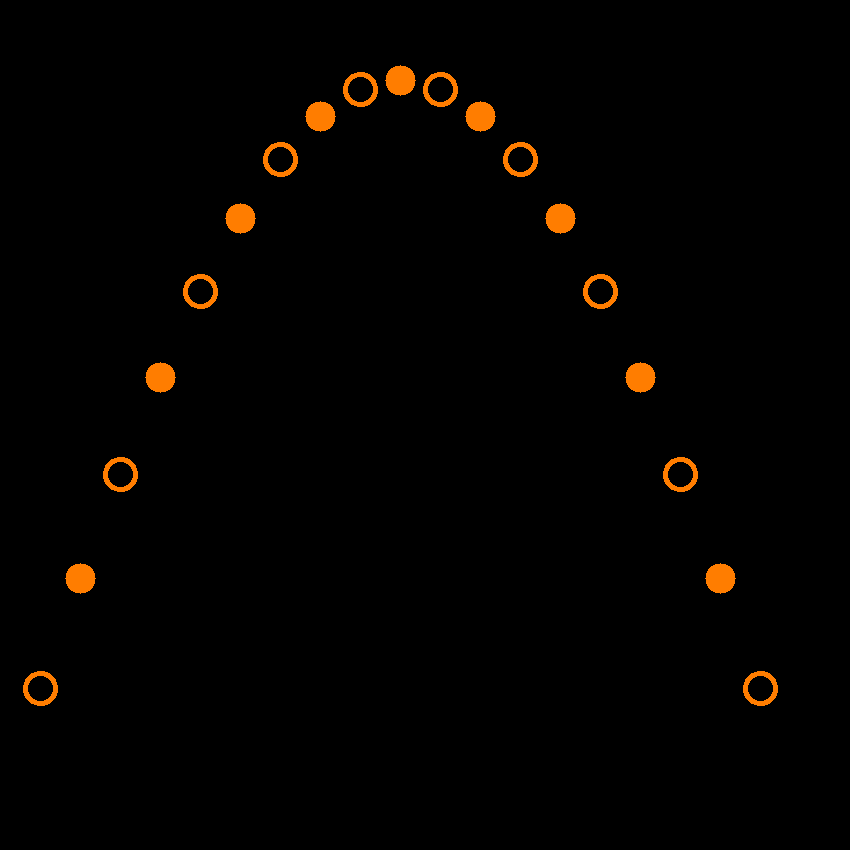
|
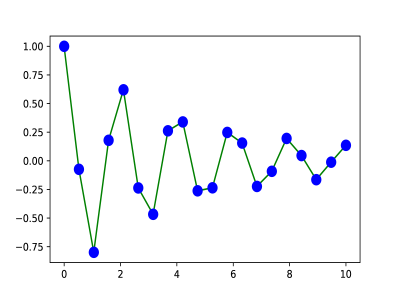
The function is this problem is \[y(x)=e^{-x/b} \cos(kx); \,\,\, b=5, \, k=\pi\] \(x\) is i the range \((0,10)\).
1. Use matplotlib to make a plot as below:
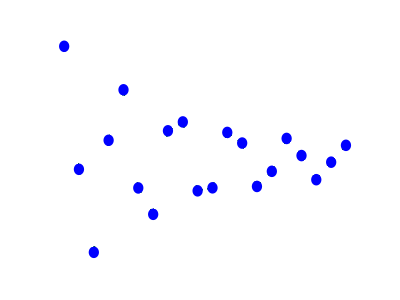
參考程式
import matplotlib
import matplotlib.pyplot as plt
import numpy as np
import cv2
k=2*np.pi/2; b=5
x = np.linspace(0,10,20)
y = x**2
plt.plot(x,y,'g-', lw=10)
plt.plot(x,y,'rs',ms=10)
plt.savefig("matplot-1.png")
print ('plot is done')

img = cv2.imread('matplot-1.png')
imgM = cv2.resize(img, (400,300), interpolation=cv2.INTER_AREA)
img1=np.copy(imgM)
for i in range(300):
    print(i,img1[150][i][:])
Ly,Lx,c=img1.shape
for y in range(Ly):
    for x in range(Lx):
        if(np.sum(img1[y,x,:])==0): img1[y,x,:]=[255,255,255]
        if(img1[y,x,1:2] > img1[y,x,0:1] and img1[y,x,1:2] > img1[y,x,2:3]):
            img1[y,x,:]=[255,255,255]

cv2.imshow('imgM',imgM)
cv2.imshow('img1',img1)
cv2.waitKey(0)
cv2.destroyAllWindows()
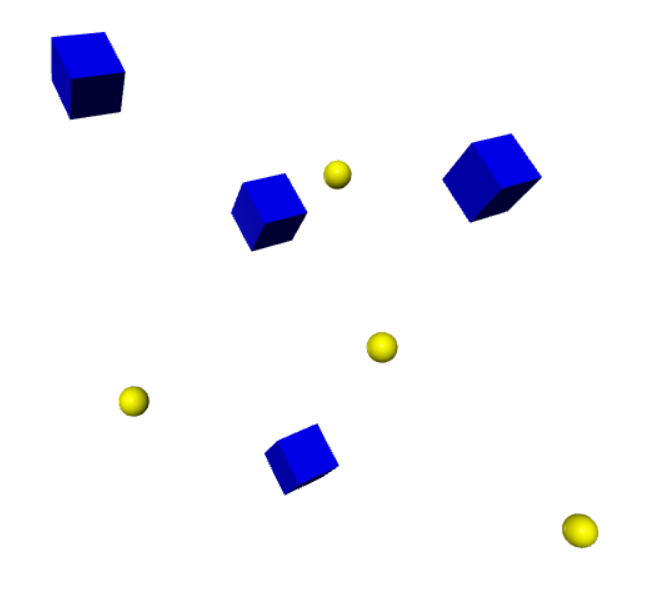
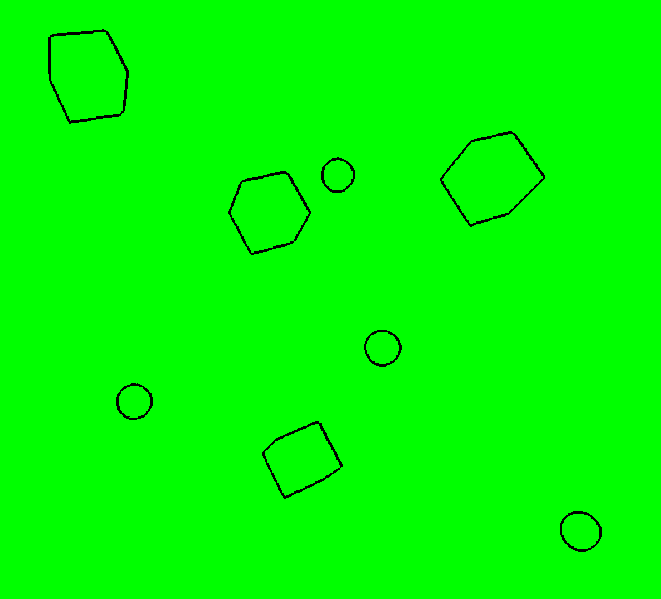
If you are given a figure as below:
If you are given a figure as below:
