用有限差分法求得微分方程的解
在古典物理中最重要的微分方程式就是牛頓的第二定律也就是在闡述位置座標對時間的微分是速度,速度對時間的微分是加速度,或者位置對時間的兩次微分是加速度,而加速度乘上物體的質量就是力量,這就連結了物體的運動行為與其受力之間的關係。也就是說,只要我們知道物體的初始位置和初始的速度,又知道其受力的函數情況,我們原則上就可以利用微分關係,解出物體運動的解。所謂物體的運動的解就是物體的位置隨著時間變化的函數關係(\(x(t), v(t)\))。 \[v(t)=\frac{dx}{dt}\] \[\frac{f}{m}=a(t)=\frac{dv}{dt}\] \[\frac{d^2x}{dt^2}=\frac{f}{m}\] 而這一套關乎運動的位置、速度與力量之間的微分關係,所形成的方程式,就叫微分方程。求解微分方程就是古典力學問題中最基本的數學工作。對一些簡單又標準的力量而言,我們可以用解析的數學方法解出這些微分方程式的精確解,但是對於一般性的情況,就不是那麼容易求解了,這時候我們的數值方法就能夠發揮所長。下面的內容我們分成兩個單元來進行,第一個,先讓同學們體驗一下我們常用的微分運算,可以用數值的方法來進行微分計算。再其次,我們將針對微分方程式用差分近似法,求得微分方程式的近似解。數值微分
微分方程的有限差分近似
自由落體的差分近似
受到空氣阻力的自由落體
- 第一個球(藍色),在真空的管子內運動,沒有受到任何空氣阻力的影響,是一個理想的自由落體運動。
- 第二個黃色的球受到空氣阻力的影響,速度雖然越來越快但最後會趨近於一個等速度運動, 那個極限的速率稱為終端速率(terminal speed)。
- 為了彰顯這個現象, 我們在第二個球的加速度小於0.1的時候,就產生第三個紅球,讓這個紅球以終端速率做等速度運動。 我們不難發現黃色的球跟紅色地球同步運動,顯現出黃色的球已經進入一個等速度運動的狀態。
GlowScript 2.9 VPython ''' 在這個程式當中我們考慮一個進行自由落體運動的物體受到空氣阻力的影響。 假設阻力的大小可以表示為下面的公式: fr=-mCv, m=落體質量C=阻力係數,v=速度, 請注意到阻力的方向總是與物體運動的方向相反,所以他會削減掉速度的大小,動能就會損失。 然而由於地球的重力,物體的速度一直受到向下的加速,空氣阻力使他減速, 最後在這兩種力量大小相等,合力為零的時候將會,落體趨近於一個等速度運動。''' import math import matplotlib import matplotlib.pyplot as plt m=0.1; N=200; v=0; g=9.8; h=40; y=h; y2=h; v2=0; C=0.01 t=0; dt=0.1; dur=int(dt*1000) for i in range(N): x=0 x2=0.3 v+=-g*dt y+=v*dt fn='imag_'+'{:03d}'.format(i)+'.png' if(abs(v2) < 0.01): fr=0 else: fr=-C*v2/abs(v2)*v2**2 a2=-g+fr/m v2+=a2*dt y2+=v2*dt t+=dt if(y < 0): v=0; y=0 if(y2 < 0): v2=-v2 plt.figure(facecolor='k') ax = plt.gca() ax.set_facecolor('k') #fig.patch.set_facecolor('xkcd:mint green') ss='t={:3.1f} {:6.2f} {:6.2f} {:6.2f} {:6.2f}'.format(t,a2,v2,y2,y) print(i,fn,ss) plt.text(-0.7,48,ss, fontsize="15", color='w') plt.xlim(-1,1) plt.ylim(-1.0,45) plt.plot(x,y,'bo',ms='4') plt.plot(x2,y2,'ro',ms='4') plt.plot([-1,1],[-1.,-1.],'w-',lw=3) plt.savefig(fn,facecolor='k') if(y2 < 0): break #if(v > 0 and abs(v) < 1.0): break #break import glob from PIL import Image, ImageDraw frames = [Image.open(image) for image in sorted(glob.glob('imag*.png'))] frame_one = frames[0] frame_one.save("FreeFall_2.gif", format="GIF", append_images=frames, save_all=True, duration=dur, loop=1) print('freefall is done')受到空氣阻力的自由落體(gif)
FreeFall_2.gif
SHM-1
import math import matplotlib import matplotlib.pyplot as plt import numpy as np import time pi=np.pi; sin=np.sin; cos=np.cos; sqrt=np.sqrt k=10; m=1.0; A=1; v=0; N=200; x=A; y=0; T=2*pi*sqrt(m/k) t=0; dt=0.02; dur=int(dt*1000*5) NS=8; dx=x/NS for i in range(N): if(t > T): break fn='imag_'+'{:03d}'.format(i)+'.png' plt.figure(facecolor='k') ax = plt.gca() ax.set_facecolor('k') ss='t={:4.2f} {:6.2f} {:6.2f}'.format(t,x,v) print(fn,ss) plt.text(0.,0.5,ss, fontsize="15", color='w') plt.xlim(-2,2) plt.ylim(-1,1) plt.plot(x,y,'bo',ms='8') plt.plot([-2,2],[0,0],'w-',lw=1) plt.savefig(fn,facecolor='k') a=-k*x/m v+=a*dt x+=v*dt t+=dt import glob from PIL import Image, ImageDraw frames = [Image.open(image) for image in sorted(glob.glob('imag*.png'))] frame_one = frames[0] frame_one.save("SHM_1.gif", format="GIF", append_images=frames, save_all=True, duration=dur, loop=4) print('SHM-1 is done')SHM-1(gif)
SHM_1.gif
SHM-1(gif)
SHM_1S.gif
SHM_2D.gif
SHM_2C.gif
SHM_gif_2.py
import matplotlib.pyplot as plt
import numpy as np
def f(x):
fx=np.sin(x)
return fx
a=0.; b=2.*np.pi; N=20
dx=(b-a)/N
x1=np.arange(a,b,dx)
x2=np.arange(a+dx,b+dx,dx)
fx=f(x1)
fp=(f(x2)-f(x1))/dx
fpex=np.cos(x1)
s5='%9.4f'*5
for i in range(N):
print(s5 %(x1[i],x2[i],fx[i],fp[i],fpex[i]))
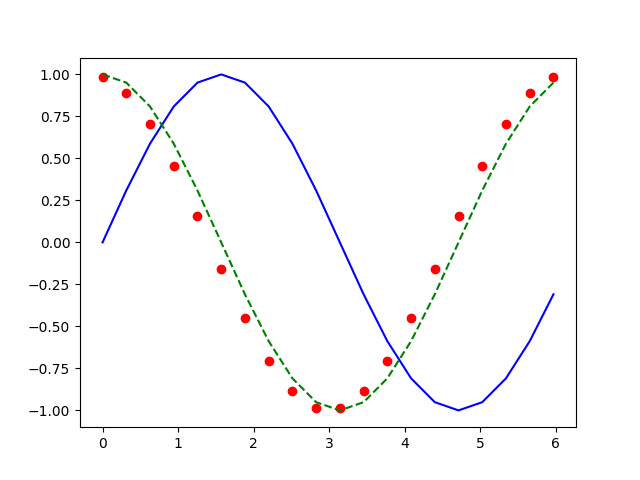
plt.plot(x1,fx,'b-')
plt.plot(x1,fp,'ro')
plt.plot(x1,fpex,'g--')
plt.savefig("num-diff.png")
print ('plot is done')
|
============輸出:============= 0.0000 0.3142 0.0000 0.9836 1.0000 0.3142 0.6283 0.3090 0.8873 0.9511 0.6283 0.9425 0.5878 0.7042 0.8090 0.9425 1.2566 0.8090 0.4521 0.5878 1.2566 1.5708 0.9511 0.1558 0.3090 1.5708 1.8850 1.0000 -0.1558 0.0000 1.8850 2.1991 0.9511 -0.4521 -0.3090 2.1991 2.5133 0.8090 -0.7042 -0.5878 2.5133 2.8274 0.5878 -0.8873 -0.8090 2.8274 3.1416 0.3090 -0.9836 -0.9511 3.1416 3.4558 0.0000 -0.9836 -1.0000 3.4558 3.7699 -0.3090 -0.8873 -0.9511 3.7699 4.0841 -0.5878 -0.7042 -0.8090 4.0841 4.3982 -0.8090 -0.4521 -0.5878 4.3982 4.7124 -0.9511 -0.1558 -0.3090 4.7124 5.0265 -1.0000 0.1558 -0.0000 5.0265 5.3407 -0.9511 0.4521 0.3090 5.3407 5.6549 -0.8090 0.7042 0.5878 5.6549 5.9690 -0.5878 0.8873 0.8090 5.9690 6.2832 -0.3090 0.9836 0.9511 plot is done |
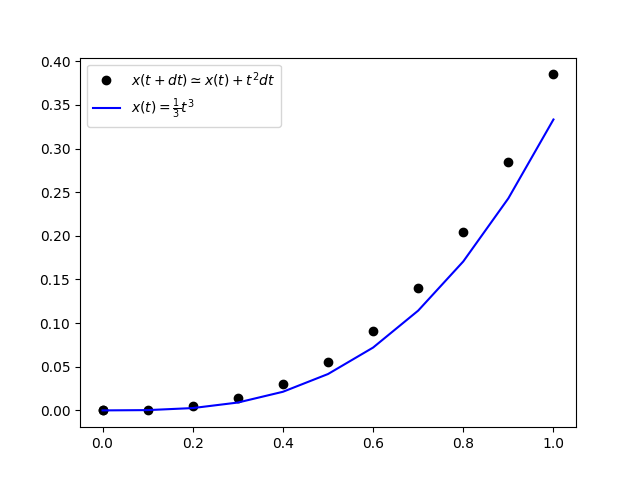
\(x(t+dt)=x(t)+t^2dt\)
\(x(0)=x_0=0\)
\(x(0.1)=x(0)+0^2(0.1)=0\)
\(x(0.2)=x(0.1)+0.1^2(0.1)=0.001\)
\(x(0.3)=x(0.2)+0.2^2(0.1)=0.001+0.2^2(0.1)=0.005\)
\(x(0.4)=x(0.3)+0.3^2(0.1)=0.005+0.3^2(0.1)=0.014\)
\(x(0.5)=x(0.4)+0.4^2(0.1)=0.014+0.4^2(0.1)=0.030\)
\(x(0.6)=x(0.5)+0.5^2(0.1)=0.030+0.5^2(0.1)=0.055\)
\(x(0.7)=x(0.6)+0.6^2(0.1)=0.055+0.6^2(0.1)=0.091\)
\(x(0.8)=x(0.7)+0.7^2(0.1)=0.091+0.7^2(0.1)=0.140\)
\(x(0.9)=x(0.8)+0.8^2(0.1)=0.140+0.8^2(0.1)=0.204\)
\(x(1.0)=x(0.9)+0.9^2(0.1)=0.204+0.9^2(0.1)=0.285\)
在下面的程式中,我們實現了這個想法並且數值上完全與用手計算出來的結果吻合,當然我們也把精確的解(\(x(t)=\frac{1}{3}t^3\))一起放在同一個圖形裡做比較。雖然近似值高估了函數值,但是整體而言是符合精確解的函數行為。並且我們相信只要把微量時間取得更細微,近似的數值將會更精確,同學們可以自己嘗試計算各種不同大小的微量時間所得的精度。
import matplotlib.pyplot as plt
import numpy as np

dt=0.1; N=int(1./dt)+2
t=0; x=0; xp=t**2; xx=t**3/3.
t1=[]; x1=[]; xp1=[]; xx1=[]
for i in range(1,N):
    xp=t**2
    x=x+xp*dt
    xx=t**3/3.
    t1.append(t)
    xp1.append(xp)
    x1.append(x)
    xx1.append(xx)
    print ('%9.4f %9.4f %9.4f %9.4f' %(t,xp,x,xx))
    t=dt*i
plt.figure()
plt.plot(t1,x1,'ko', label=r'$x(t+dt) \simeq x(t)+t^2 dt$')
plt.plot(t1,xx1,'b', label=r'$x(t)=\frac{1}{3}t^3$')
plt.legend()
plt.savefig("finite-diff-1.png")
print ('plot is done')
|
============輸出:============= 0.0000 0.0000 0.0000 0.0000 0.1000 0.0100 0.0010 0.0003 0.2000 0.0400 0.0050 0.0027 0.3000 0.0900 0.0140 0.0090 0.4000 0.1600 0.0300 0.0213 0.5000 0.2500 0.0550 0.0417 0.6000 0.3600 0.0910 0.0720 0.7000 0.4900 0.1400 0.1143 0.8000 0.6400 0.2040 0.1707 0.9000 0.8100 0.2850 0.2430 1.0000 1.0000 0.3850 0.3333 plot is done |
自由落體問題我們得到的精確解,包括速度對時間的函數以及位置對時間的函數關係,但是我們仍然可以比較使用有限差分近似法,來求自由落體的數值近似解: \[v(t+dt) \simeq v(t) + g dt \] \[x(t+dt) \simeq x(t) + v dt \] 運動的初始條件為:\(x(0)=h, v(0)=0, g=-9.8\)。
根據以上的分析,我們寫出下面的程式,並且使用vpython來模擬整個自由落體運動的過程。
反彈跳躍的球
import math
import matplotlib
import matplotlib.pyplot as plt

m=0.1; N=100; v=0; g=9.8; h=20; y=h;
t=0; dt=0.1; dur=int(dt*1000)
for i in range(N):
    x=0
    v+=-g*dt
    y+=v*dt
    t+=dt
    if(y < 0): v=-v
    fn='imag_'+'{:03d}'.format(i)+'.png'
    plt.figure(facecolor='k')
    ax = plt.gca()
    ax.set_facecolor('k')
    ss='t={:3.1f}'.format(t)
    print(fn,ss)
    plt.text(-0.7,24,ss, fontsize="15", color='w')
    plt.xlim(-1,1)
    plt.ylim(0,25)
    plt.plot(x,y,'bo',ms='4')
    plt.plot([-1,1],[0,0],'w-',lw=3)
    plt.savefig(fn,facecolor='k')
    if(v > 0 and abs(v) < 1.0): break
    #break

import glob
from PIL import Image, ImageDraw
frames = [Image.open(image) for image in sorted(glob.glob('imag*.png'))]
frame_one = frames[0]
frame_one.save("FreeFall_1.gif", format="GIF", append_images=frames,
               save_all=True, duration=dur, loop=3)

print('freefall is done')
|
反彈跳躍的球(gif)
FreeFall_1.gif\[f=f_g+f_r=-mg-mCv \] \[a=f/m=-g-Cv \]