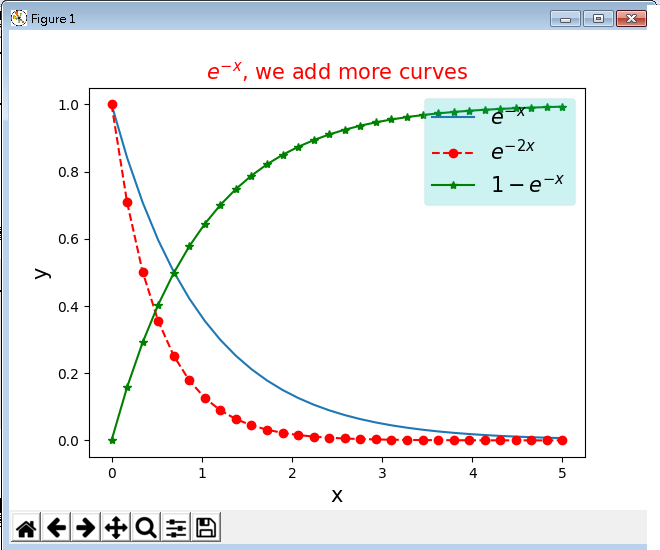
利用numpy陣列建立畫圖數據 加入文字xlabel, ylabel, title, text 一圖多曲線 - label='$e^{-x}$' 曲線的標示
- plt.legend()顯示圖標
- facecolor='c'圖標區塊的背景顏色
- framealpha=0.2圖標區塊背景顏色的透明度0=完全透明;1=完全不透明
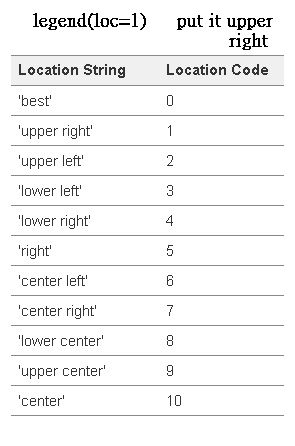
- loc=1圖標的位置,不加入時由系統決定最佳位置。
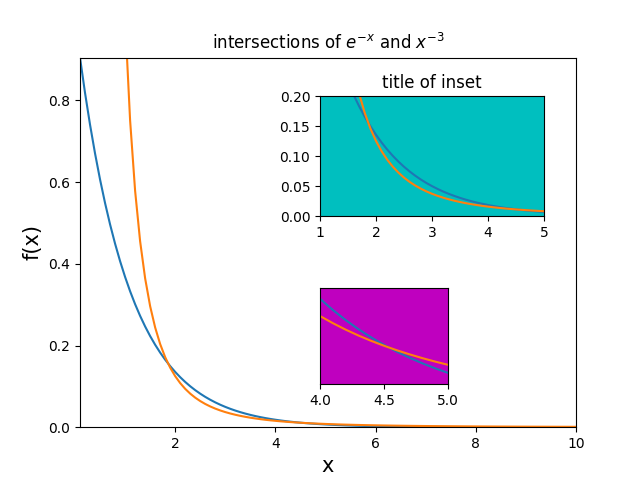
多圖框 符號,顏色,線 控制x軸和y軸的範圍與插圖 軸的控制 -
-
-
matplot畫圖程式庫
-
matplotlib及其數值數學擴展包 NumPy是利用Python程式語言進行數值方法學習時非常重要的兩個工具。在我們這個數值方法的課程中同學們只要能夠熟悉PYTHON語言的基本語法另外善用matplot和NUMPY這兩個資料庫的許多工具,來完成數值計算和繪圖顯示,就可以學到整個數值方法的精髓。
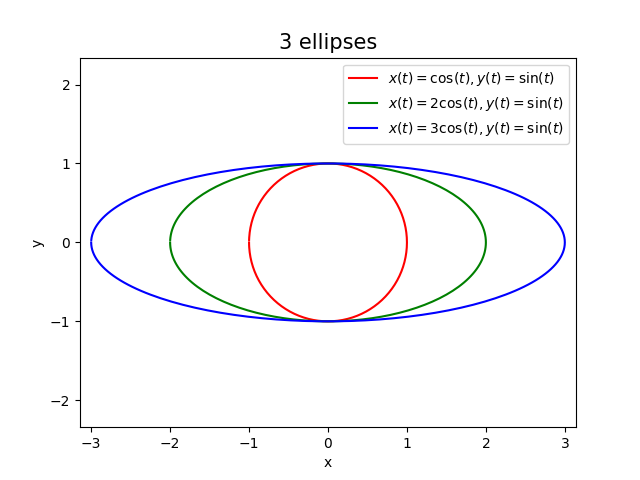
在這一個小單元當中我們要介紹matplot的繪圖基本套件。我們先從簡單的二維平面圖形的繪圖開始,然後再推廣到三維空間的繪圖。學習的方式非常簡單,那就是從範例的繪圖程式出發,比照程式與繪圖結果之間的呼應關係就能夠了解所有繪圖套件的用法。在二維的繪圖方面我們會先重從點與線的繪圖,再慢慢加入三角函數的曲線、拋物線、圓、橢圓及用參數的方式所繪製的二維曲線,包括常見的極座中常見的心臟線和玫瑰線的 。外我們也會介紹多圖框的繪製方法 以及如何在圖中加入標示。
同學們可以參考下列網站有關matplot所做的簡單介紹:
以下是本課程相關的matplot的基本用法說明:
NUM-matplot-sin.py | |
# in PYTHONANYWHERE-------------
import matplotlib
import matplotlib.pyplot as plt
import numpy as np
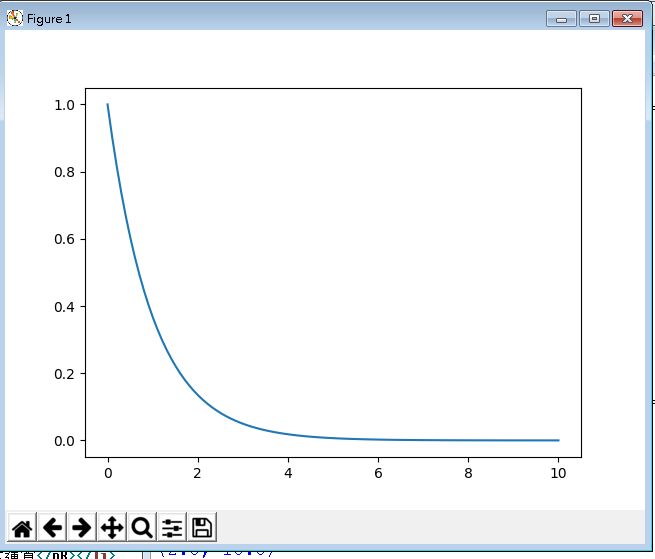
x = np.linspace(0,10,100)
y = np.exp(-x)
plt.plot(x,y)
plt.savefig("exp-x.png")
print ('plot is done')
|
 |
# in anaconda---------------------
import matplotlib
import matplotlib.pyplot as plt
import numpy as np
x = np.linspace(0,10,100)
y = np.exp(-x)
plt.plot(x,y)
plt.show()
print ('plot is done')
|
|
subplots in rows and columns | |
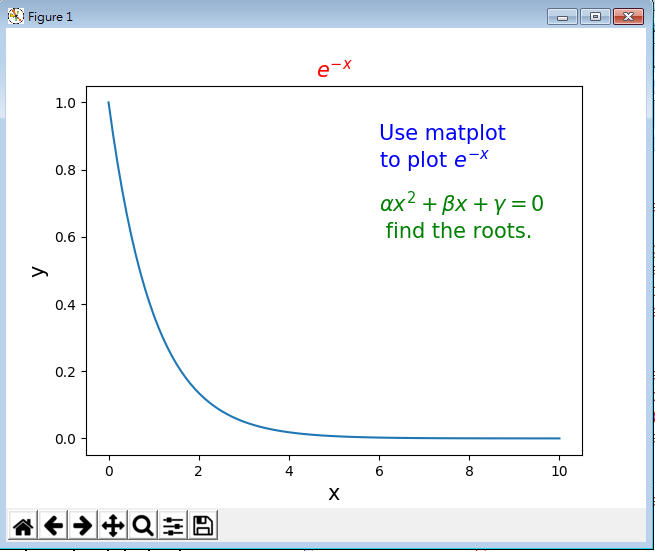
r'$\alpha x^2 + \beta x +\gamma=0$' 可列出latex文字宇方程式。\n為換行符號。
The r preceding the string is important – it signifies that the string is a raw string and not to treat backslashes as python escapes.。
6,0.8和6,0.6是文字放置的座標點。
| |
import matplotlib
import matplotlib.pyplot as plt
matplotlib.use("Agg")
import numpy as np
x = np.linspace(0,10,100)
y = np.exp(-x)
plt.plot(x,y)
plt.xlabel('x', fontsize=15)
plt.ylabel('y', fontsize=15)
plt.title('$e^{-x}$', color='red', fontsize=15)
plt.text(6, 0.8,'Use matplot \n to plot $e^{-x}$', \
     color='b', fontsize=15)
plt.text(6, 0.6,r'$\alpha x^2+\beta x + \gamma=0$'\
         +'\n find the roots.'
	 , color='g', fontsize=15)
plt.savefig("matplot-2.png")
print ('plot is done')
|
 |
一圖多曲線 | ||
import matplotlib
import matplotlib.pyplot as plt
matplotlib.use("Agg")
import numpy as np
x = np.linspace(0,5,30)
plt.plot(x,np.exp(-x),label='$e^{-x}$')
plt.plot(x,np.exp(-2.*x),'r--o',label='$e^{-2x}$')
plt.plot(x,1-np.exp(-x),'g-*',label='$1-e^{-x}$')
plt.legend(facecolor='c', framealpha=0.2,loc=1, fontsize=15)
plt.xlabel('x', fontsize=15)
plt.ylabel('y', fontsize=15)
plt.title('$e^{-x}$, we add more curves', color='red', fontsize=15)
plt.savefig("matplot-3.png")
print ('plot is done')
|
|
|
  |
||
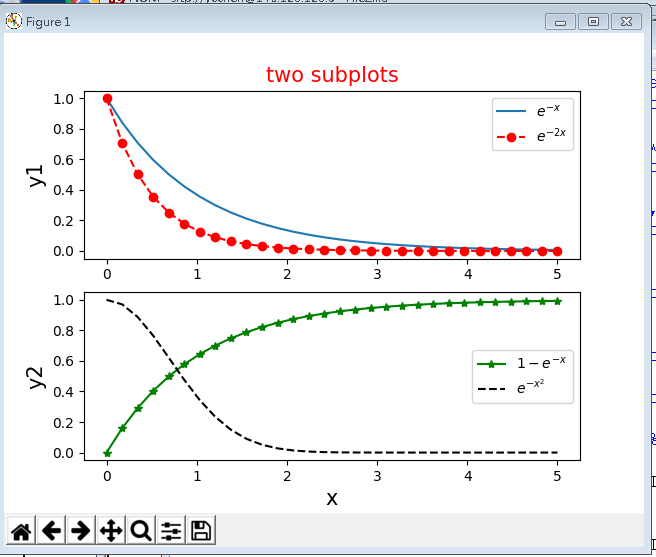
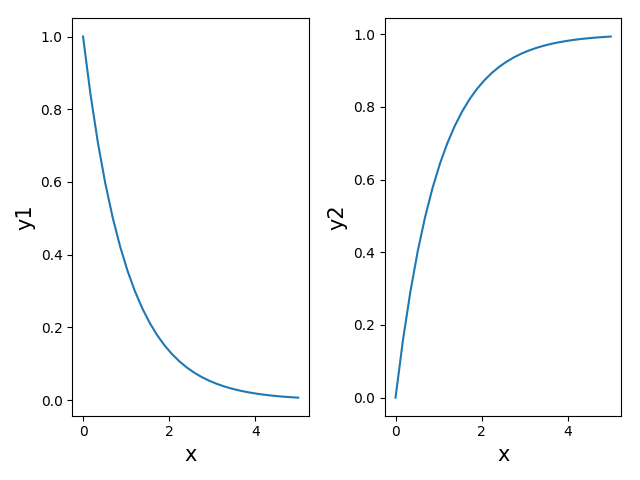
subplots in rows | ||
import matplotlib
import matplotlib.pyplot as plt
matplotlib.use("Agg")
import numpy as np
x = np.linspace(0,5,30)
plt.subplot(211)
plt.plot(x,np.exp(-x),label='$e^{-x}$')
plt.plot(x,np.exp(-2.*x),'r--o',label='$e^{-2x}$')
plt.ylabel('y1', fontsize=15)
plt.legend()
plt.title('two subplots', color='red', fontsize=15)

plt.subplot(212)
plt.plot(x,1-np.exp(-x),'g-*',label='$1-e^{-x}$')
plt.plot(x,np.exp(-x**2),'k--',label='$e^{-x^2}$')
plt.legend()
plt.xlabel('x', fontsize=15)
plt.ylabel('y2', fontsize=15)
plt.savefig("matplot-4.png")
print ('plot is done')
|
 |
|
subplots in columns | ||
import matplotlib.pyplot as plt import numpy as np x = np.linspace(0,5,30) |
 |
|
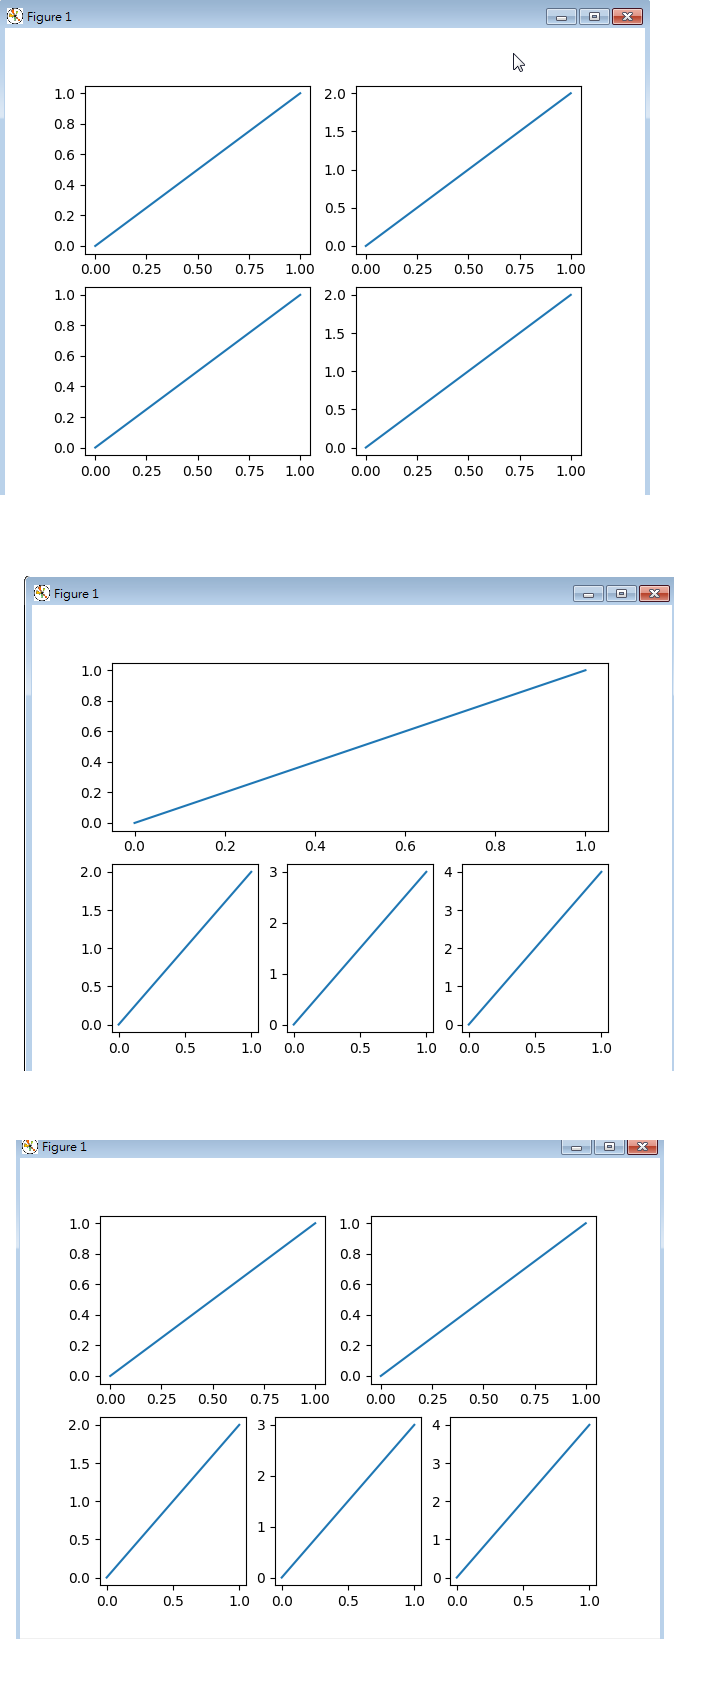
subplots in rows and columns | ||
#--------------------------------
import matplotlib
import matplotlib.pyplot as plt
matplotlib.use("Agg")
import numpy as np
ax1=plt.subplot(2,2,1)
plt.plot([0,1],[0,1])
plt.subplot(2,2,2)
plt.plot([0,1],[0,2])
plt.subplot(2,2,3)
plt.plot([0,1],[0,1])
plt.subplot(2,2,4)
plt.plot([0,1],[0,2])
plt.savefig("matplot-6A.png")

plt.subplot(2,1,1)
plt.plot([0,1],[0,1])
plt.subplot(2,3,4)
plt.plot([0,1],[0,2])
plt.subplot(235)
plt.plot([0,1],[0,3])
plt.subplot(236)
plt.plot([0,1],[0,4])
plt.savefig("matplot-6B.png")

plt.subplot(2,2,1)
plt.plot([0,1],[0,1])
plt.subplot(2,2,2)
plt.plot([0,1],[0,1])
plt.subplot(2,3,4)
plt.plot([0,1],[0,2])
plt.subplot(235)
plt.plot([0,1],[0,3])
plt.subplot(236)
plt.plot([0,1],[0,4])
plt.savefig("matplot-6C.png")
print ('plot is done')
|
 |
|
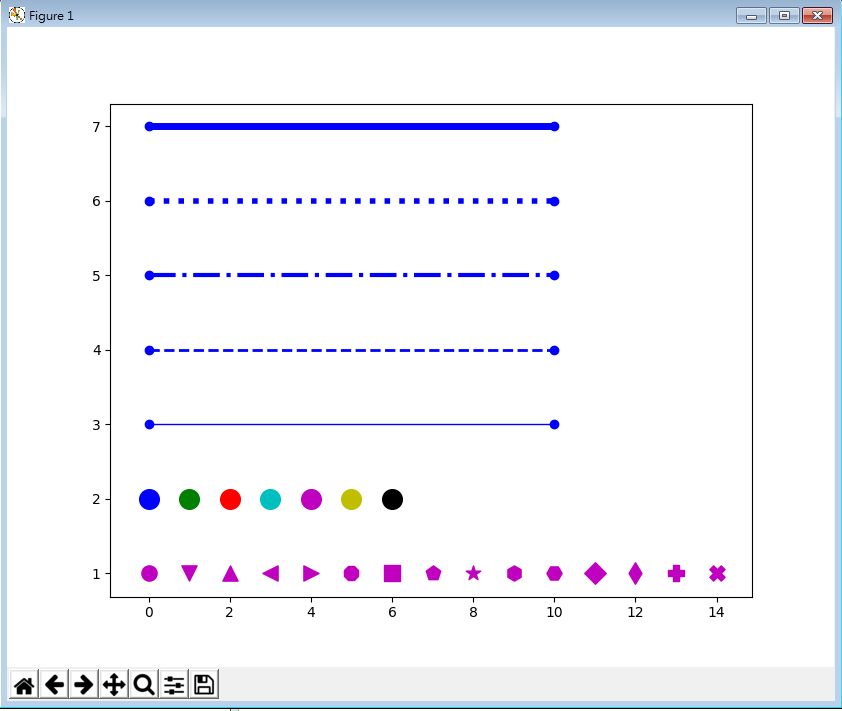
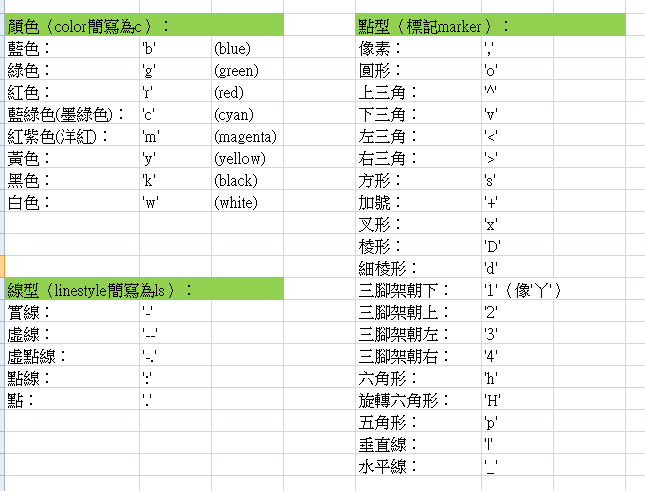
符號,顏色,線 | ||
import matplotlib
import matplotlib.pyplot as plt
matplotlib.use("Agg")
import numpy as np
mk=['o', 'v', '^', '<', '>', '8', 's', 'p', '*', 'h', 'H', \
        'D', 'd', 'P', 'X']
clr=['b', 'g', 'r', 'c', 'm', 'y', 'k', 'w']
lsty=[ '-' , '--' , '-.' ,':' ,'steps']
for i in range(15):
    plt.scatter(i, 1, s=120, c='m', marker=mk[i])
for i in range(8):
    plt.scatter(i, 2, s=200, c=clr[i], marker='o')
for i in range(5):
    plt.plot([0,10],[3+i,3+i],'o-', c='blue', lw=i+1,ls=lsty[i])
plt.savefig("matplot-7.png")
print ('plot is done')
| ||
  |
||
import matplotlib
import matplotlib.pyplot as plt
matplotlib.use("Agg")
import numpy as np
x = np.linspace(0.1,10,100)
y1 = np.exp(-x)
y2 = x**(-3.)
X1=np.amin(x); X2=np.amax(x); Y1=np.amin(y1); Y2=np.amax(y1)
# --------------主要的圖形------
plt.plot(x,y1)
plt.plot(x,y2)
plt.axis([X1,X2,Y1,Y2])  #控制x軸與y軸的繪圖範圍
plt.xlabel('x', fontsize=15)
plt.ylabel('f(x)', fontsize=15)
plt.title('intersections of $e^{-x}$ and $x^{-3}$')
#--------------次要的插圖-------
a = plt.axes([0.5, 0.55, 0.35, 0.25], facecolor='c')
#建立一個新插圖的位置和底色0.5,0.55是插圖左下角的座標;0.35=圖寬,0.25=圖高
plt.plot(x,y1)
plt.plot(x,y2)
plt.axis([1,5,0,0.2])  #控制插圖x軸與y軸的繪圖範圍
plt.title('title of inset')
#--------------最小的插圖-------
a = plt.axes([.5, .2, .2, .2], facecolor='m')
plt.plot(x,y1)
plt.plot(x,y2)
plt.axis([4,5,0.005,0.02])
plt.yticks([])   #隱藏最小插圖的y軸尺標
plt.savefig("matplot-8.png")
print ('plot is done')
import numpy as np
import matplotlib.pyplot as plt
fig, ax1 = plt.subplots(1,1)
x=np.linspace(0,2*np.pi)
y=np.sin(x)
x1 = [0,np.pi/2,np.pi,3*np.pi/2,2*np.pi]
y1 = [-1,-0.5,0,0.25,0.5,0.75,1]
x1t = [0,r'$\frac{\pi}{2}$','$\pi$',r'$\frac{3\pi}{2}$','$2\pi$']
y1t=['-1','-0.5','0','quater', 'half', '3 quaters', 'full']
ax1.set_xticks(x1)
ax1.set_yticks(y1)
ax1.set_xticklabels(x1t, minor=False, rotation=0)
ax1.set_yticklabels(y1t, minor=False, rotation=45)
plt.grid()
ax1.plot(x,y)
plt.savefig("matplot-9.png")
print ('plot is done')
Example codes for matplot
NUM-matplot-sin.py | ||
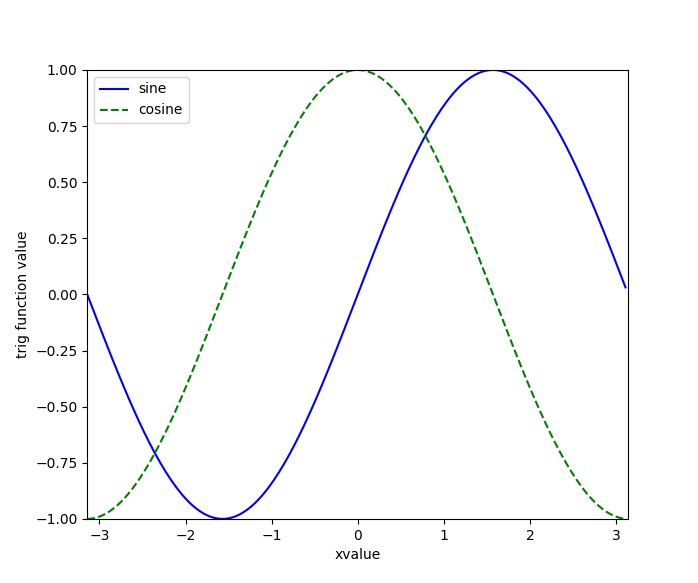
import matplotlib
import matplotlib.pyplot as plt
matplotlib.use("Agg")
import numpy as np
pi=np.pi
x=np.arange(-pi,pi,pi/100)
plt.plot(x,np.sin(x),'b-',label='sine')
plt.plot(x,np.cos(x),'g--',label='cosine')
plt.xlabel('xvalue')
plt.ylabel('trig function value')
plt.xlim(-pi,pi)
plt.ylim(-1,1)
plt.legend(loc='upper left')
plt.savefig("matplot-9.png")
print ('plot is done')
|
 |
|
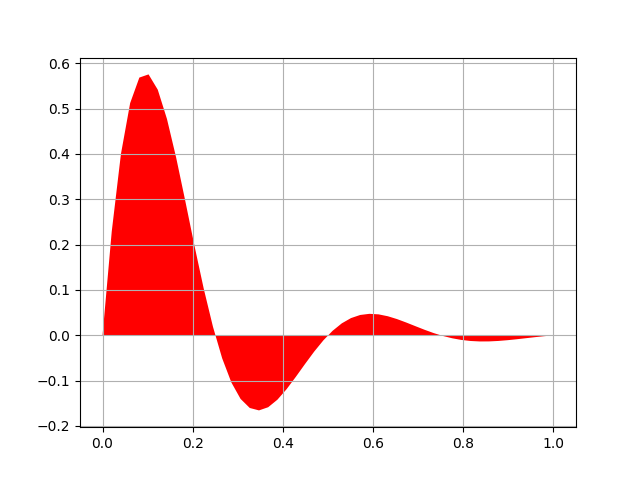
fill function | ||
import matplotlib
import matplotlib.pyplot as plt
matplotlib.use("Agg")
import numpy as np
"""
Simple demo of the fill function.
"""
import numpy as np
import matplotlib.pyplot as plt


x = np.linspace(0, 1)
y = np.sin(4 * np.pi * x) * np.exp(-5 * x)

plt.fill(x, y, 'r')
plt.grid(True)
plt.savefig("matplot-10.png")
print ('plot is done')
|
 |
|
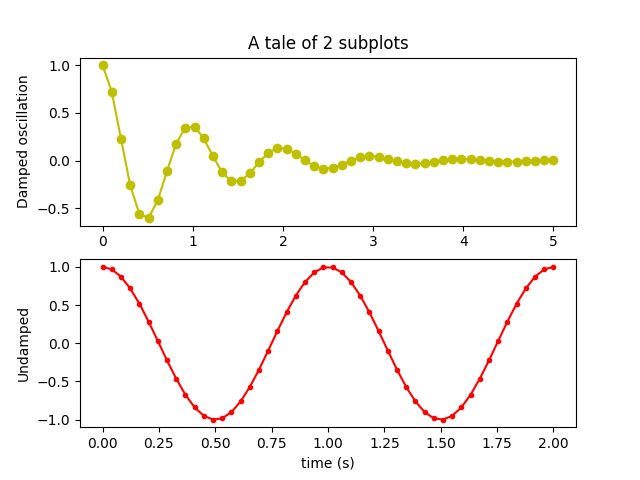
multiple subplots | ||
import matplotlib
import matplotlib.pyplot as plt
matplotlib.use("Agg")
import numpy as np
x1 = np.linspace(0.0, 5.0)
x2 = np.linspace(0.0, 2.0)
y1 = np.cos(2 * np.pi * x1) * np.exp(-x1)
y2 = np.cos(2 * np.pi * x2)

plt.subplot(2, 1, 1)
plt.plot(x1, y1, 'yo-')
plt.title('A tale of 2 subplots')
plt.ylabel('Damped oscillation')

plt.subplot(2, 1, 2)
plt.plot(x2, y2, 'r.-')
plt.xlabel('time (s)')
plt.ylabel('Undamped')
plt.savefig("matplot-11.png")
print ('plot is done')
|
 |
|
circle and arrow | ||
import matplotlib
import matplotlib.pyplot as plt
import numpy as np
matplotlib.use("Agg")
t=np.linspace(0,2*np.pi,100)
x=np.cos(t)
y=np.sin(t)
plt.axis("equal")
hl=0.1
plt.plot(x,y,'r-', lw='3')
plt.plot([0,0.707],[0,0.707],'k-', lw='2')
plt.plot(0.0,0.0, 'bo')
plt.plot(0.5,0.0, 'bo')
plt.plot(1.2,1.4, 'wo', ms='1')
plt.text(0.3,0.5,r"$a$", fontsize="25")
plt.text(0.3,-0.2,r"$(0,0.5)$", fontsize="15")
plt.arrow(0,0,0.5-hl,0,head_width=0.05, head_length=hl, fc='k', ec='k' )
plt.arrow(-1.2,0,2.4-hl,0,head_width=0.05, head_length=hl, fc='k', ec='k' )
plt.arrow(0,-1.2,0,2.4-hl,head_width=0.05, head_length=hl, fc='k', ec='k' )
plt.xlabel('x', fontsize="15", color='b')
plt.ylabel('y', fontsize="15", color='b')
plt.savefig("2d-circle-arrow")
print ('plot is done')
| ||
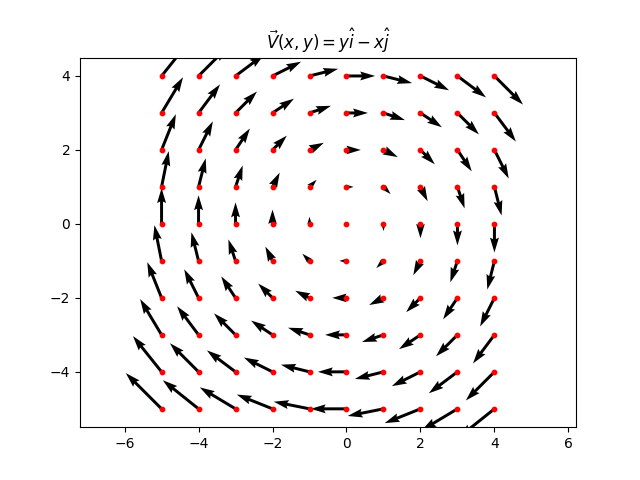
向量場繪圖 | ||
import matplotlib
import matplotlib.pyplot as plt
import numpy as np
matplotlib.use("Agg")
X, Y = np.meshgrid(np.arange(-5,5, 1), np.arange(-5,5, 1))
U=Y; V=-X
plt.figure()
plt.quiver(X, Y, U, V, units='width')
plt.axis("equal")
plt.title(r'$\vec{V}(x,y)=y\hat{i}-x\hat{j}$')
plt.scatter(X, Y, color='r', s=10)
plt.savefig("2d-quiver-rotate.png")
print ('plot is done')
| ||
 |
||
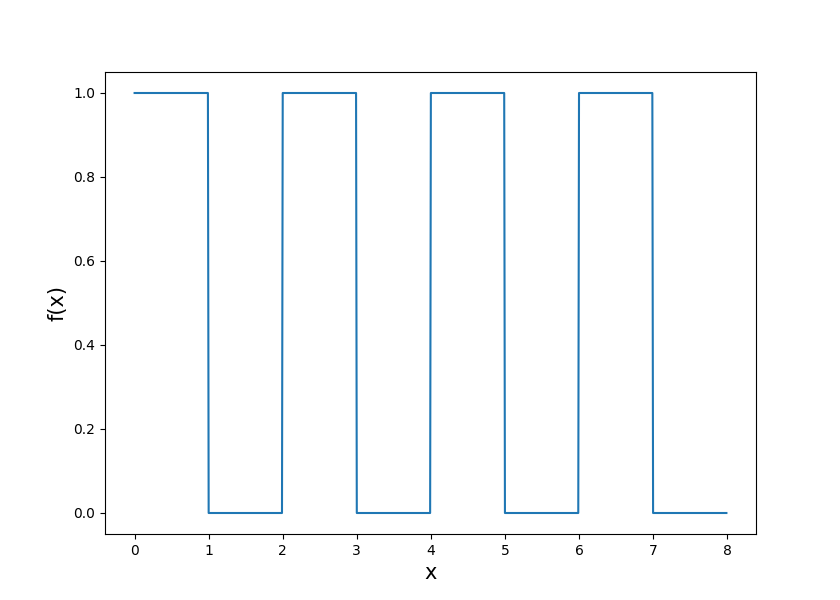
畫方波 | ||
import matplotlib.pyplot as plt
import numpy as np

x=[]; y=[]
for i in range(800):
    x1=0.01*i
    if(int(x1)%2==0): y1=1
    else: y1=0
    x.append(x1)
    y.append(y1)
plt.plot(x,y)
plt.xlabel('x', fontsize=15)
plt.ylabel('f(x)', fontsize=15)
plt.show()
|
 |
|