PYTHON基本語法-2
在這個講次當中我們準備了3個程式來加深各位同學對於迴圈以及邏輯判斷的應用。
-
質數問題
- for num 迴圈跑過lower and upper之間的所有整數,迴圈內的計算再確定num是否為質數。
- 什麼是質數?就是一個整數除了1之外,沒有任何比他小的整數可以整除這個整數,那麼這個整數就是質數:for i in range(2,num):
- 進入迴圈之前我們讓K=0
- 在迴圈中只要有任何一個整數i可以整除num,終止迴圈的運算並且將K=1
- for i迴圈執行結束之後如果K的值等於1就表示num不是質數,若K仍然等於0,num就是質數,就打印出。
lower = 900
upper = 1000
print("Prime numbers between",lower,"and",upper,"are:")
for num in range(lower,upper + 1):
    K=0
    for i in range(2,num):
        if (num % i) == 0:
            K=1
            break
    if(K==0):  print(num)
Prime numbers between 900 and 1000 are: 907 911 919 929 937 941 947 953 967 971 977 983 991 997
-
閏年與平年
- 2017年不是一個閏年
- 1900年是一個不閏年
- 2012年是一個閏年
- 2000年是閏年
- while迴圈
- 用input輸入
- 三層嵌套的if ... else
# coding=Big5
while True:
    year = int(input("Enter a year:(Enter 0 to stop) "))
    if(year == 0):  break
    if (year % 4) == 0:
       if (year % 100) == 0:
           if (year % 400) == 0:
               print(year,'是閏年(2)')
           else:
               print(year,'是平年(2)')
       else:
           print(year,'是閏年(1)')
    else:
       print(year,'是平年(1)')
Enter a year:(Enter 0 to stop) 1920 1920 是閏年(1) Enter a year:(Enter 0 to stop) 1922 1922 是平年(1) Enter a year:(Enter 0 to stop) 2000 2000 是閏年(2) Enter a year:(Enter 0 to stop) 1900 1900 是平年(2) Enter a year:(Enter 0 to stop) 0
-
查找最大的
# coding=Big5
num1 = 10
num2 = 14
num3 = 15
if (num1 >= num2) and (num1 >= num3):
   largest = num1
   print('case 1')
elif (num2 >= num1) and (num2 >= num3):
   largest = num2
   print('case 2')
else:
   largest = num3
   print('case 3')
print num1,num2,num3,' The largest number=',largest
#===========螢幕上可以看到的輸出結果======= case 2 10 14 12 The largest number= 14 ===================== RESTART ====================== case 3 10 14 15 The largest number= 15
-
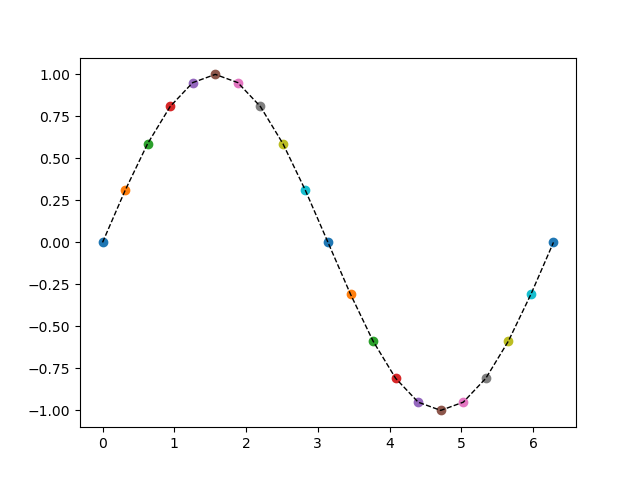
引入數學與繪圖模組
import math
pi=math.pi
sin=math.sin
sqrt=math.sqrt
exp=math.exp
import matplotlib
import matplotlib.pyplot as plt
import math
import matplotlib
import matplotlib.pyplot as plt
pi=math.pi; sin=math.sin
N=20; dx=2*pi/N; Lx=[]; Ly=[]
for i in range(N+1):
    x=dx*i
    y=sin(x)
    Lx.append(x); Ly.append(y)
    #print(i,x,y)
    print('{0:3d} {1:8.4f} {2:8.4f}'.format(i,x,y))
    plt.plot(x,y,'o')
plt.plot(Lx,Ly,'k--',lw=1)
plt.savefig("sinx.png")
print('plot is done')
0 0.0000 0.0000 1 0.3142 0.3090 2 0.6283 0.5878 3 0.9425 0.8090 4 1.2566 0.9511 5 1.5708 1.0000 6 1.8850 0.9511 7 2.1991 0.8090 8 2.5133 0.5878 9 2.8274 0.3090 10 3.1416 0.0000 11 3.4558 -0.3090 12 3.7699 -0.5878 13 4.0841 -0.8090 14 4.3982 -0.9511 15 4.7124 -1.0000 16 5.0265 -0.9511 17 5.3407 -0.8090 18 5.6549 -0.5878 19 5.9690 -0.3090 20 6.2832 -0.0000 plot is done
-
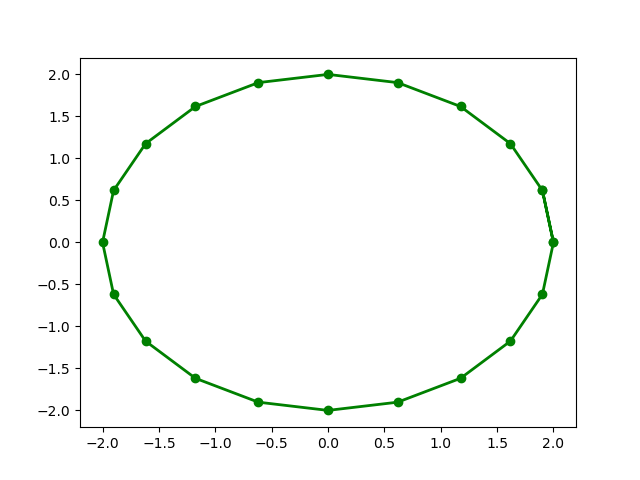
numpy畫圓1
import numpy as np
import matplotlib
import matplotlib.pyplot as plt
R=2;N=21; dt=2*np.pi/(N-1); Lx=[]; Ly=[]
for i in range(N+1):
    t=dt*i
    x=R*np.cos(t)
    y=R*np.sin(t)
    Lx.append(x); Ly.append(y)
    print('{0:3d} {1:8.4f} {2:8.4f} {3:8.4f}'.format(i,t,x,y))
plt.plot(Lx,Ly,'go-',lw=2)
plt.savefig("circle01.png")
plt.figure()
plt.axis("equal")
plt.plot(Lx,Ly,'r-',lw=3)
plt.savefig("circle02.png")
print('plot is done')
0 0.0000 2.0000 0.0000 1 0.3142 1.9021 0.6180 2 0.6283 1.6180 1.1756 3 0.9425 1.1756 1.6180 4 1.2566 0.6180 1.9021 5 1.5708 0.0000 2.0000 6 1.8850 -0.6180 1.9021 7 2.1991 -1.1756 1.6180 8 2.5133 -1.6180 1.1756 9 2.8274 -1.9021 0.6180 10 3.1416 -2.0000 0.0000 11 3.4558 -1.9021 -0.6180 12 3.7699 -1.6180 -1.1756 13 4.0841 -1.1756 -1.6180 14 4.3982 -0.6180 -1.9021 15 4.7124 -0.0000 -2.0000 16 5.0265 0.6180 -1.9021 17 5.3407 1.1756 -1.6180 18 5.6549 1.6180 -1.1756 19 5.9690 1.9021 -0.6180 20 6.2832 2.0000 -0.0000 21 6.5973 1.9021 0.6180 plot is done
-
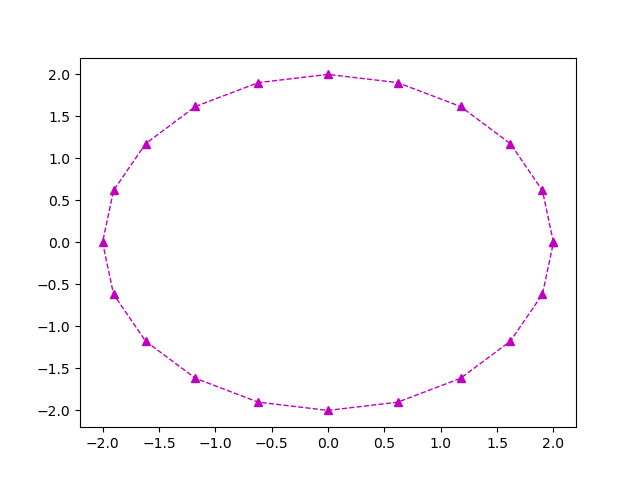
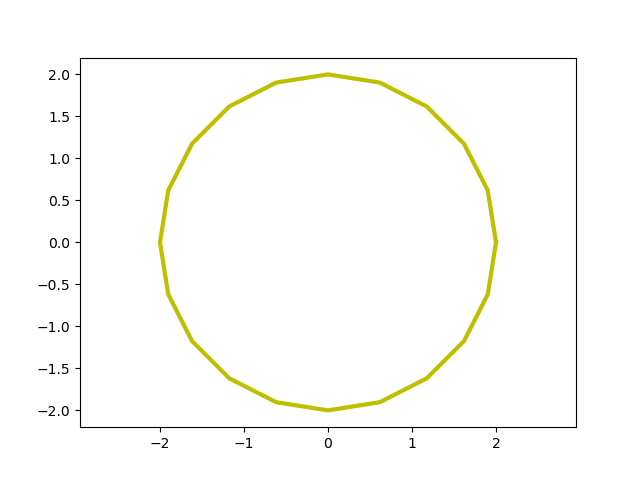
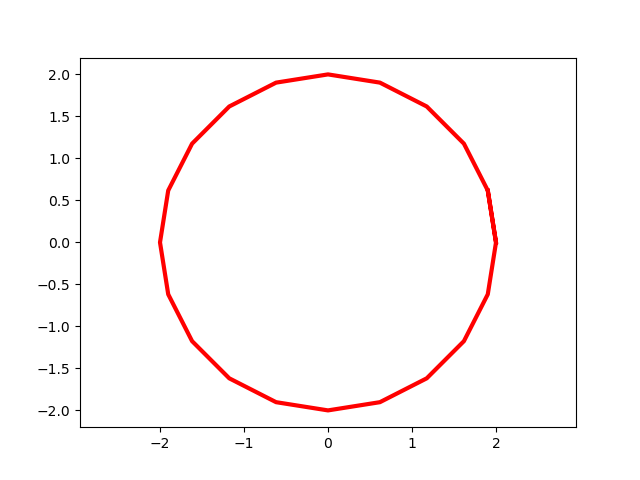
numpy畫圓2
import numpy as np
import matplotlib
import matplotlib.pyplot as plt
R=2;N=21; dt=2*np.pi/(N-1)
print('pi=',np.pi)
t=np.arange(0,2*np.pi,dt)
print('t=',t)
x=R*np.cos(t)
y=R*np.sin(t)
print('x=',x)
plt.plot(x,y,'m^--',lw=1)
plt.savefig("circle03.png")
plt.figure()
plt.axis("equal")
plt.plot(x,y,'y-',lw=3)
plt.savefig("circle04.png")
print('plot is done')
pi= 3.141592653589793 t= [0. 0.31415927 0.62831853 0.9424778 1.25663706 1.57079633 1.88495559 2.19911486 2.51327412 2.82743339 3.14159265 3.45575192 3.76991118 4.08407045 4.39822972 4.71238898 5.02654825 5.34070751 5.65486678 5.96902604] x= [ 2.00000000e+00 1.90211303e+00 1.61803399e+00 1.17557050e+00 6.18033989e-01 1.22464680e-16 -6.18033989e-01 -1.17557050e+00 -1.61803399e+00 -1.90211303e+00 -2.00000000e+00 -1.90211303e+00 -1.61803399e+00 -1.17557050e+00 -6.18033989e-01 -3.67394040e-16 6.18033989e-01 1.17557050e+00 1.61803399e+00 1.90211303e+00] plot is done