-
單擺的微分方程式
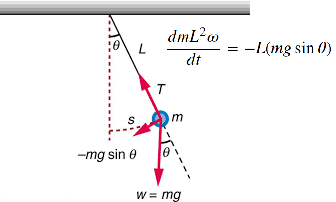
\[ \tau=\frac{dL}{dt} ,L=I\omega, I=mL^2 \rightarrow \frac{dmL^2\omega}{dt}=-L(mg\sin\theta) \] 當單擺的擺動幅度很小時,\(\theta \lt\lt 1, \sin \theta \simeq \theta\) \[ \frac{d\omega}{dt}=-(g/L) \sin\theta \rightarrow \frac{d\omega}{dt}=-(g/L)\theta \] \[ \frac{d\omega}{dt}=\alpha(\theta)=-(g/L) \sin(\theta) \] \[ \frac{d \theta}{dt}=\omega \] 在小角度的震盪下,單擺的微分方程式就簡化為與簡諧震盪相同的微分方程式。 -
差分近似--Verlet method:
\[ \frac{\theta_{n+1}-2\theta_n+\theta_{n-1}}{\tau^2}=-(g/L) \sin(\theta) \]
\[ \theta_{n+1}=2\theta_n-\theta_{n-1}-\tau^2 (g/L) \sin(\theta) \]
-
以子彈擊中單擺
-
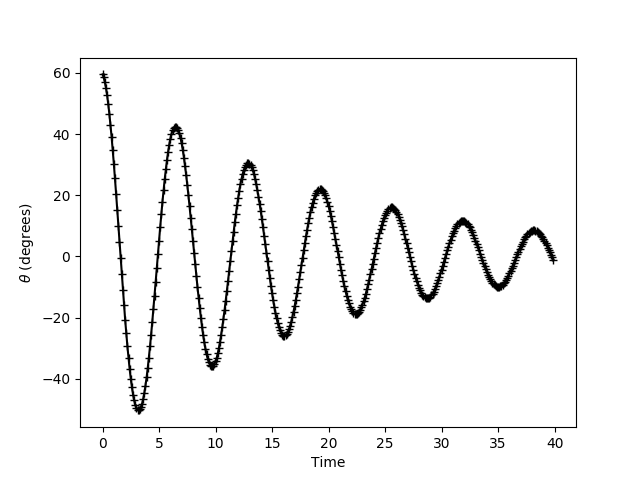
有阻尼的單擺
\[\ddot{\theta}=-\frac{g}{L}\sin\theta - \gamma \dot{\theta}\]
單擺
# pendul - Program to compute the motion of a simple pendulum
# using the Euler or Verlet method

# Set up configuration options and special features
from visual import *
import numpy as np
import matplotlib.pyplot as plt

#* Select the numerical method to use: Euler or Verlet
#NumericalMethod = input('Choose a numerical method (1: Euler; 2: Verlet): ')
NumericalMethod=2

#* Set initial position and velocity of pendulum
#theta0 = input('Enter initial angle (in degrees): ')
theta0=170.
theta = theta0 * np.pi /180     # Convert angle to radians
omega = 0.0                     # Set the initial velocity

#* Set the physical constants and other variables
g_over_L = 1.0            # The constant g/L
L=9.8*g_over_L
time = 0.0                # Initial time
irev = 0                  # Used to count number of reversals
#tau = input('Enter time step: ')
tau=0.1

scene = display(width=800, height=800, center=(0, 0, 0),
        background=(0.5,0.5,0))
r1=vector(sin(theta),-cos(theta),0)*L
str=arrow(pos=(0,0,0),axis=r1,shaftwidth=0.1)
ball=sphere(pos=r1,radius =0.5,make_trail=True,color=(0,0,0))


#* Take one backward step to start Verlet
accel = -g_over_L * np.sin(theta)    # Gravitational acceleration
theta_old = theta - omega*tau + 0.5*accel*tau**2

#* Loop over desired number of steps with given time step
#    and numerical method
#nstep = input('Enter number of time steps: ')
nstep=int(40./tau)
t_plot = np.empty(nstep)
th_plot = np.empty(nstep)
period = np.empty(nstep)   # Used to record period estimates
for istep in range(nstep):

    rate(int(1./tau))
    #* Record angle and time for plotting
    t_plot[istep] = time
    th_plot[istep] = theta * 180 / np.pi  # Convert angle to degrees
    time = time + tau

    r1=vector(sin(theta),-cos(theta),0)*L
    ball.pos=r1
    str.axis=r1
    #* Compute new position and velocity using
    #    Euler or Verlet method
    accel = -g_over_L * np.sin(theta)   # Gravitational acceleration
    if NumericalMethod == 1 :
        theta_old = theta               # Save previous angle
        theta = theta + tau*omega       # Euler method
        omega = omega + tau*accel
    else:
        theta_new = 2*theta - theta_old + tau**2 * accel
        theta_old = theta               # Verlet method
        theta = theta_new

    #* Test if the pendulum has passed through theta = 0;
    #    if yes, use time to estimate period
    if theta*theta_old < 0 :  # Test position for sign change
        print 'Turning point at time t = ',time
        if irev == 0 :          # If this is the first change,
            time_old = time     # just record the time
        else:
            period[irev-1] = 2*(time - time_old)
            time_old = time
        irev = irev + 1     # Increment the number of reversals

# Estimate period of oscillation, including error bar
nPeriod = irev-1    # Number of times the period was measured
AvePeriod = np.mean( period[0:nPeriod] )
ErrorBar = np.std(period[0:nPeriod]) / np.sqrt(nPeriod)
print 'Average period = ', AvePeriod, ' +/- ', ErrorBar

# Graph the oscillations as theta versus time
plt.plot(t_plot, th_plot, '+')
plt.xlabel('Time')
plt.ylabel(r'$\theta$ (degrees)')
plt.show()
import matplotlib
import matplotlib.pyplot as plt
matplotlib.use("Agg")
import numpy as np
#NumericalMethod = input('Choose a method (1: Euler; 2: Verlet): ')
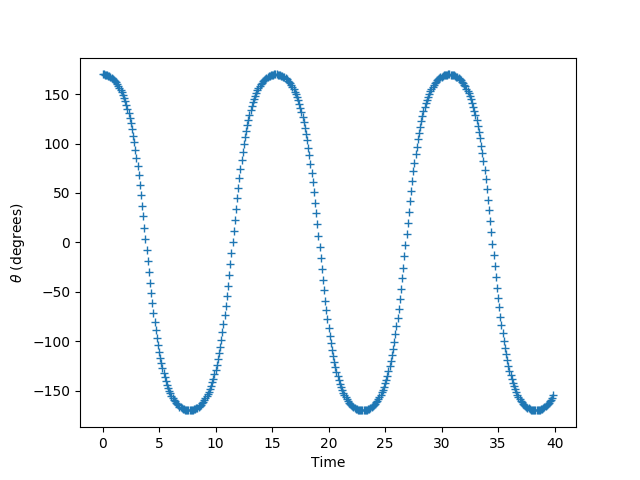
NumericalMethod=1
theta0=170.
theta = theta0 * np.pi /180 # Convert angle to radians
omega = 0.0 # Set the initial velocity
g_over_L = 1.0 # The constant g/L
L=9.8*g_over_L
time = 0.0 # Initial time
irev = 0 # Used to count number of reversals
tau=0.1
accel = -g_over_L * np.sin(theta) # Gravitational acceleration
theta_old = theta - omega*tau + 0.5*accel*tau**2
nstep=int(40./tau)
t_plot = np.empty(nstep)
th_plot = np.empty(nstep)
period = np.empty(nstep) # Used to record period estimates
for istep in range(nstep):
t_plot[istep] = time
th_plot[istep] = theta * 180 / np.pi # Convert angle to degrees
time = time + tau
accel = -g_over_L * np.sin(theta) # Gravitational acceleration
if NumericalMethod == 1 :
theta_old = theta # Save previous angle
theta = theta + tau*omega # Euler method
omega = omega + tau*accel
else:
theta_new = 2*theta - theta_old + tau**2 * accel
theta_old = theta # Verlet method
theta = theta_new
if theta*theta_old < 0 : # Test position for sign change
print ('Turning point at time t = ',time)
if irev == 0 : # If this is the first change,
time_old = time # just record the time
else:
period[irev-1] = 2*(time - time_old)
time_old = time
irev = irev + 1 # Increment the number of reversals
nPeriod = irev-1 # Number of times the period was measured
AvePeriod = np.mean( period[0:nPeriod] )
ErrorBar = np.std(period[0:nPeriod]) / np.sqrt(nPeriod)
print ('Average period = ', AvePeriod, ' +/- ', ErrorBar)
plt.plot(t_plot, th_plot, '+')
plt.xlabel('Time')
plt.ylabel(r'$\theta$ (degrees)')
plt.savefig("pendulum-1.png")
plt.close()
import matplotlib
import matplotlib.pyplot as plt
matplotlib.use("Agg")
import numpy as np
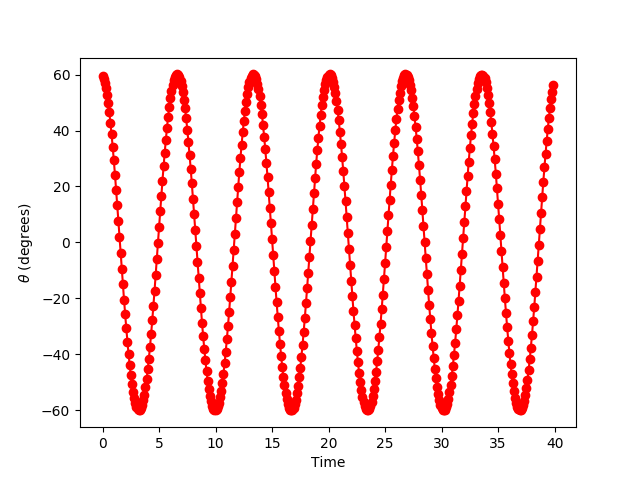
degree0=60.; theta0=np.radians(degree0); deg=degree0
th=theta0; omega = 0.0; gL = 1.0; L=9.8*gL; g=9.8; w=0.
t=0.0; irev = 0; dt=0.1; nstep=int(40./dt)
t_plot = np.empty(nstep)
th_plot = np.empty(nstep)
w_plot = np.empty(nstep)
period = np.empty(nstep)
for istep in range(nstep):
th1=th
#print ('%10.4f'*3 %(t,deg,w))
af=-gL*np.sin(th)
w+=af*dt
th+=w*dt
deg=np.degrees(th)
t_plot[istep] = t
th_plot[istep] = deg
w_plot[istep]=w
t+=dt
if th*th1 < 0 :
print ('Turning point at time t = ',t)
if irev == 0 :
tp = t
else:
period[irev-1] = 2*(t - tp)
tp = t
irev = irev + 1
nPeriod = irev-1
AvePeriod = np.mean( period[0:nPeriod] )
ErrorBar = np.std(period[0:nPeriod]) / np.sqrt(nPeriod)
Period_th=2.*np.pi*np.sqrt(L/g)
print ('%10.4f'*3 %(degree0,L,Period_th))
print ('Average period = ', AvePeriod, ' +/- ', ErrorBar)
plt.plot(t_plot, th_plot, 'r-o')
plt.xlabel('Time')
plt.ylabel(r'$\theta$ (degrees)')
plt.savefig("pendulum-2.png")
plt.close()
from visual import *
m=1.0; M=10.; g=9.8;k=10.; size = 0.05;L0 = 1.0
theta=radians(0.); omega0=-0; omega=omega0; alpha=-g*sin(theta)/L0
scene = display(width=800, height=800,center = (0, -L0/2, 0), background=(0.5,0.5,0))
x=arrow(pos=(0,0,0),axis=(1,0,0),shaftwidth=0.01,color=color.red)
x2=arrow(pos=(-1,-1,0),axis=(2,0,0),shaftwidth=0.002,color=color.white)
y=arrow(pos=(0,0,0),axis=(0,0.5,0),shaftwidth=0.01,color=color.green)
z=arrow(pos=(0,0,0),axis=(0,0,0.5),shaftwidth=0.01,color=color.blue)
ceiling = box(length=0.2, height=0.001, width=0.2, color=color.blue)
ball = sphere(radius = size, color=color.blue,trail_type="curve",interval=2, retain=20)
string = cylinder(pos=(0,0,0), axis=(0,-1,0),radius=0.003,color=color.cyan)
bull = cylinder(radius = size/2, pos=(-1,-1,0),axis=(size,0,0),color=color.red)
bull.v=vector(20,0,0)
ball.pos = vector(L0*sin(theta), -L0*cos(theta), 0)

dt = 0.01
t=0.
while abs(bull.pos-ball.pos) > size*2:
    rate(20)
    bull.pos.x=bull.pos.x+bull.v.x*dt
    t=t+dt

ball.visible=False
bull.visible=False
f = frame()
B1 = sphere(frame=f, pos=ball.pos-(0,-1,0), radius = size, color=color.blue)
B2 = cylinder(frame=f, pos=bull.pos-(0,-1,0), radius = size/2, axis=(size,0,0),color=color.red)
f.pos=ball.pos
f.v=m*bull.v.x/(m+M)
omega=f.v/L0


while True:
    rate(50)
    alpha = -g*sin(theta)/L0
    omega += alpha*dt
    theta += omega*dt
    f.pos = vector(L0*sin(theta), -L0*cos(theta), 0)
    string.axis = f.pos - string.pos
    t=t+dt
import matplotlib
import matplotlib.pyplot as plt
matplotlib.use("Agg")
import numpy as np

degree0=60.; theta0=np.radians(degree0); deg=degree0
th=theta0; omega = 0.0; gL = 1.0; L=9.8*gL; g=9.8; w=0.
gamma=0.1
t=0.0; irev = 0; dt=0.1; nstep=int(40./dt)
t_plot = np.empty(nstep)
th_plot = np.empty(nstep)
w_plot = np.empty(nstep)
period = np.empty(nstep)
for istep in range(nstep):
    th1=th
    #print ('%10.4f'*3 %(t,deg,w))
    af=-gL*np.sin(th)-gamma*w
    w+=af*dt
    th+=w*dt
    deg=np.degrees(th)
    t_plot[istep] = t
    th_plot[istep] = deg
    w_plot[istep]=w
    t+=dt
    if th*th1 < 0 :
        print ('Turning point at time t = ',t)
        if irev == 0 :
            tp = t
        else:
            period[irev-1] = 2*(t - tp)
            tp = t
        irev = irev + 1
nPeriod = irev-1
AvePeriod = np.mean( period[0:nPeriod] )
ErrorBar = np.std(period[0:nPeriod]) / np.sqrt(nPeriod)
Period_th=2.*np.pi*np.sqrt(L/g)
print ('%10.4f'*4 %(gamma,degree0,L,Period_th))
print ('Average period = ', AvePeriod, ' +/- ', ErrorBar)
plt.plot(t_plot, th_plot, 'k-+')
plt.xlabel('Time')
plt.ylabel(r'$\theta$ (degrees)')
plt.savefig("pendulum-3.png")
plt.close()